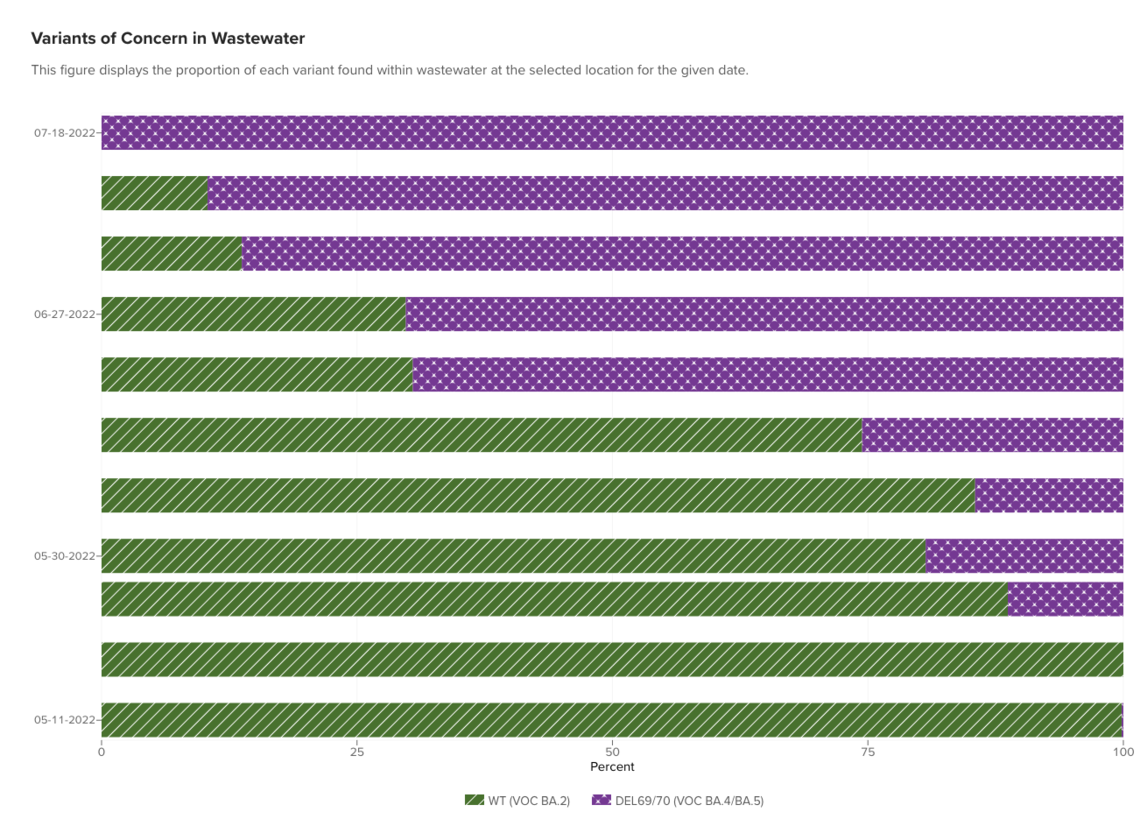
Screenshot of SARS-CoV-2 variant data from the COVID-19 Wastewater Data Tracker.
July 27, 2022

The University of Calgary’s online wastewater data tracker now offers insights on COVID-19 variants and the seasonal flu in two new data sets. Citizens have visibility into what COVID-19 variants are the most prevalent in Alberta and how they are increasing over time, as well as data about the amount of influenza virus present in Alberta communities, based on wastewater analysis.
This data is monitored as part of the pan-Alberta wastewater monitoring partnership led by the universities of Calgary and Alberta, in partnership with Alberta Health, Alberta Health Services, Alberta Precision Laboratories, The City of Calgary, EPCOR, and 18 other municipal partners throughout Alberta.
The tracker, created and maintained by the Cumming School of Medicine’s Centre for Health Informatics, is a popular source of information for Albertans. During the initial Omicron wave of COVID-19 at the beginning of 2022, the website had over a quarter of a million visits.
Dr. Casey Hubert, PhD, professor in the Faculty of Science, and Dr. Michael Parkins, MD, professor in the Cumming School of Medicine, answered questions about what the new data means and why it’s important for citizens and health-care professionals.
Hubert: We’ve added two new types of data to the tracker: SARS-CoV-2 variant data, and influenza data.
The variant data is presented in a horizontal bar graph. It displays the relative proportion of each variant of COVID-19 detected within the wastewater samples. Scrolling up shows how the prevalence of each variant changes over time, with the most recent data at the top. In recent weeks we see the purple bar for BA.4 and BA.5 displacing the green bar for BA.2.
The flu data is presented on a line graph. It can be interpreted similarly to the COVID-19 figures on the website. The exact data points as well as the three-point average are displayed. Influenza A and influenza B data are both available, and can be switched between via a toggle in the top left of the graph.

Screenshot of SARS-CoV-2 variant data from the COVID-19 Wastewater Data Tracker.
Hubert: Genetic material from SARS-CoV-2, the virus that causes COVID-19, is excreted in the feces of those who are pre-symptomatic, asymptomatic, as well as those with overt symptoms.
Our measurements and analysis of that genetic material are the data that you see on the COVID-19 wastewater data tracker.
After we gather wastewater samples, we measure how much SARS-CoV-2 genetic material is in each one. To do that, we screen for specific genes of SARS-CoV-2, and these main target genes haven’t mutated in any of the variants. That means we can continue to accurately quantify the amount of SARS-CoV-2 in the wastewater without adjusting our screening tools. We're constantly checking to make sure that our screening tools are still a perfect match for the main target genes whenever a new variant comes along.
We are also able to discern what variants are in the wastewater by using screening tools that are diagnostic for the genetic mutations that are unique to each variant. Right now, we are screening for the genetic mutations of BA.4 and BA.5. The new data in the tracker shows the amount of BA.4 and 5 genes in each wastewater sample, relative to BA.2 and other variants.
Parkins: We are seeing a little bit of a different dynamic in that BA.4 and BA.5 have been in Alberta for quite some time at low levels without displacing the dominant strain. This is different than with the original Omicron BA.1 and subsequent BA.2 strains, where as soon as we saw them in Alberta, they rapidly displaced the prior dominant strains (i.e., BA.1 displaced Delta; BA.2 displaced BA.1).
However BA.4 and 5 have been in Alberta for a number of weeks, and only recently started to climb and rapidly push out BA.2. We’re not sure why that is, but that’s what we’ve seen in the wastewater as well as through clinical testing.
Parkins: Not necessarily. This is what viruses do – they mutate and change, and it's not always the case that a new variant is inherently more transmissible.
We've also got a human population that changes over time, and has different susceptibilities to infection for each strain-type based on their changing immune protection, whether from vaccination or from prior infection.
At this moment iBA.4 and BA.5 are more likely to be transmitted than BA.2. The population is less protected against this new variant. In the past, when we've seen a new variant come into a population, we've seen that associate with a surge in cases and a new wave. So, this has all the hallmarks of a new wave coming.
Parkins: Monitoring the shift between variants using wastewater is relevant for us clinicians because some of the therapeutics that we use in hospital for severe cases become less and less effective as variants evolve. We've been able to use wastewater data to determine when we're going to suggest that clinicians stop using certain treatments that are effective for one strain and not another, allowing us to pivot to a new therapy.
Parkins: It's about their individual risk. Now that we're seeing signs of a changing wave, someone who's at medium risk or low risk for COVID-19 adverse outcomes would want to take increasing precautions. Whereas someone who is high risk should take extra precautions at all times.
Hubert: Regardless of the variant of the day, the public is encouraged to check the tracker website and watch overall levels of SARS-CoV-2 in wastewater. Each of us can use this tool to make evidence-based decisions, similar to how we make choices after checking the weather app on our smart phones.
Parkins: It is still early days with the influenza screening. We have observed strong correlations over short time periods between influenza levels in community wastewater and cases clinically confirmed in those areas, as have other researchers doing this work elsewhere.
Given the profound impact influenza has every year on respiratory illnesses and hospitalizations, this wastewater testing strategy could prove a powerful tool to forecast disease, ready health-care resources, and tailor anti-flu therapies.
Michael Parkins is a professor in the departments of Medicine, and Microbiology, Immunology and Infectious Diseases at the Cumming School of Medicine. He is a member of the Snyder Institute for Chronic Diseases. He is section chief of Infectious Disease, Calgary Zone Alberta Health Services.
Casey Hubert is a professor in the department of Biological Sciences in the Faculty of Science and Campus Alberta Innovates Program Chair in Geomicrobiology.
The UCalgary wastewater team processes wastewater samples at Advancing Canadian Water Assets (ACWA) a globally unique test bed and research facility where researchers, municipalities and industry can de-risk wastewater treatment and monitoring technologies. It is a partnership between the University of Calgary and The City of Calgary, as part of the Urban Alliance.